+1 (226) 337-9660

 English
Search

Predictive maintenance is the strategy that monitors the actual condition of equipment to predict failures before they occur. Instead of replacing parts on fixed schedules or waiting for a machine to break down, predictive maintenance collects operational data (vibration, temperature, oil quality, among others) and uses that information to schedule interventions at the exact moment they are needed.
For industries that operate high-value equipment where an unplanned shutdown can cost millions, such as sugar-energy plants, cement facilities, steel mills, and mining operations, this approach changes the way maintenance is planned and executed.
In this guide, you will learn how predictive maintenance works, what techniques are available, how to implement it, and specifically how to apply it to speed reducers and mechanical power transmission equipment.
Predictive maintenance is a set of techniques that uses continuous monitoring and data analysis to identify signs of degradation in equipment while still at an early stage, allowing the maintenance team to intervene before functional failure occurs.
The Brazilian standard NBR 5462 from ABNT defines predictive maintenance as one that ensures asset monitoring based on the systematic application of analysis techniques, using centralized supervision or sampling methods, with the goal of minimizing preventive maintenance and reducing corrective maintenance.
The core objective of predictive maintenance is to anticipate failures so the team can act before the equipment stops working. When applied consistently, predictive maintenance contributes to:
According to McKinsey, predictive maintenance can reduce machine downtime by 30% to 50% and increase equipment lifespan by 20% to 40%.
For an engineer responsible for mill drive gear reducers at a sugar-energy plant, for example, these figures mean harvest seasons with fewer interruptions, higher crushing volumes, and fewer emergency work orders during the most critical period of operation.

Predictive maintenance follows a continuous cycle of four stages: data collection, transmission and storage, predictive analysis, and planned action.
Sensors installed on equipment capture information such as vibration, temperature, pressure, electrical current, and lubricant oil quality. This collection can be continuous (sensors connected 24 hours a day, transmitting data in real time) or periodic (technicians taking measurements along inspection routes with portable instruments at defined intervals).
This is the stage where data reaches a centralized platform. In operations with industrial IoT, sensors send information through the cloud, enabling remote monitoring. In operations with manual collection, data is entered into analysis software after each inspection.
Machine learning algorithms, statistical models, and the expertise of specialized analysts compare collected data against reference patterns (known as baseline) and identify deviations that indicate degradation. A gradual increase in a reducer's vibration, for example, may indicate bearing wear weeks before a functional failure.
When the analysis identifies an anomaly, the team schedules the intervention for the most appropriate time, without impacting production. Depending on severity, the response can range from a more detailed inspection to a planned shutdown for component replacement.
An important point: predictive maintenance does not rely exclusively on sophisticated technology. Operational observation remains part of the process. Unusual noises, heat noticeable to the touch, abnormal vibrations identified by experienced operators — all of these are signals that help direct deeper analysis. Technology improves accuracy, but the field team's perception is complementary and valuable.
Learn more: How to improve Industrial Gearbox efficiency and extend its service life
There are three main maintenance strategies in industry:
Corrective maintenance happens after the failure has already occurred. The equipment breaks down, stops working, and the team acts to repair it. It is the most expensive and risky approach, because it generates unexpected shutdowns, high emergency costs, and can cause secondary damage to other components.
Preventive maintenance follows a fixed schedule based on time, operating hours, or duty cycles. The team performs inspections and component replacements at predetermined intervals, regardless of the equipment's actual condition. It reduces failures compared to corrective maintenance, but may generate unnecessary interventions (replacing a part that is still in good condition) or fail to prevent failures that arise between inspections.
Predictive maintenance is based on the equipment's actual condition. Monitoring data indicates when intervention is needed, allowing maintenance to happen at the right time: neither too early nor after the problem has worsened.
|
Criteria |
Corrective |
Preventive |
Predictive |
|
When it happens |
After failure |
At scheduled intervals |
When data indicates the need |
|
Basis for decision |
Equipment breakdown |
Time or accumulated use |
Actual asset condition |
|
Relative cost |
High (emergency) |
Medium (may be unnecessary) |
Optimized (acts at the right time) |
|
Risk of unplanned downtime |
High |
Medium |
Low |
|
Technology required |
Minimal |
Low to medium |
Medium to high |
According to the U.S. Department of Energy, preventive maintenance yields savings of 12% to 18% compared to corrective maintenance, while predictive maintenance achieves savings of 25% to 30%.
The three strategies do not compete with each other. The best maintenance program combines all three, deploying them strategically: predictive for critical, high-value assets; preventive for less complex equipment; and corrective only in situations where the cost of prevention exceeds the cost of repair.

Predictive techniques are monitoring methods that allow assessing equipment condition without needing to disassemble it or interrupt its operation. The choice of technique depends on the type of equipment, the most likely failure mode, and asset criticality.
It is common to combine two or more techniques for a more complete diagnosis. A speed reducer, for example, can be monitored simultaneously by vibration analysis (to detect mechanical problems) and oil analysis (to assess internal wear and lubricant contamination).
Vibration analysis is the most widely used technique in predictive maintenance for rotating equipment, such as motors, pumps, fans, compressors, and speed reducers.
Every piece of rotating equipment vibrates during operation. Under normal conditions, this vibration follows a predictable pattern. Deviations from this pattern indicate problems. Accelerometers installed at strategic points on the machine capture vibration signals, which are converted into frequency spectra and analyzed by specialized software.
Problems detected by this technique include:
In speed reducers, vibration analysis is particularly effective at identifying wear in gear trains and bearing deterioration, two of the most common failures in these machines. Vibrational changes typically appear weeks or months before functional failure, allowing enough time to schedule the intervention.
Thermography uses infrared cameras to capture thermal radiation emitted by equipment and create temperature maps. Areas with higher-than-expected temperatures indicate problems such as overheating, poor electrical contact, overload, insulation failure, or excessive friction.
It is a technique widely applied to electrical systems (panels, transformers, circuit breakers), motors, piping, and bearings. Inspection is quick, requires no contact with the equipment, and allows covering large areas in a short time.
Oil analysis evaluates both the condition of the lubricant and the internal state of the equipment. A periodically collected oil sample is sent to a laboratory, where parameters such as viscosity, acidity, water content, and the presence of contaminants are assessed.
The presence of metallic particles in the oil is an important indicator. Iron, copper, or bronze particles point to wear in gears, bearings, or bushings. Ferrography, which is an extension of oil analysis, identifies the type, size, and shape of these particles, indicating with greater precision which component is deteriorating and at what stage the wear has reached.
For speed reducers, oil analysis is one of the most relevant techniques. Lubricant quality directly impacts the lifespan of gears and bearings. Using oils outside of specification or with high contamination levels accelerates wear and can cause catastrophic failures. That is why it is essential to use approved lubricants that meet the standards recommended by the equipment manufacturer.
Ultrasound captures high-frequency sounds (above 20 kHz), inaudible to the human ear, to detect phenomena such as leaks, friction, electrical discharges, and early-stage bearing failures.
It is especially useful for:
The advantage of ultrasound is its sensitivity to very subtle changes, which allows identifying failures at an extremely early stage, when there is still no visible impact on equipment performance.
Motor electrical testing (MET) measures parameters such as current, voltage, resistance, and impedance to evaluate the health of electric motors and generators. The analysis covers six fault zones: stator, rotor, air gap, insulation, power supply, and power quality.
Current imbalances, insulation drops, or harmonics in the power supply are signs that indicate deterioration before the motor reaches functional failure. This technique is important because electric motors are the most common drives in industry and represent a significant share of energy consumption.
Laser alignment ensures that the shafts of coupled machines (motor-reducer, motor-pump, motor-compressor) are perfectly aligned. Misalignments, even small ones, generate excessive vibration, bearing overheating, and premature wear of couplings, bearings, and seals.
Laser measurement offers micrometric precision and is performed with the equipment assembled, eliminating the need for disassembly. After alignment, the reduction in vibration level is immediate and measurable.
Industrial endoscopy uses flexible inspection cameras (borescopes or videoscopes) to access hard-to-reach internal areas. It allows visualizing cracks, corrosion, residue buildup, and wear without disassembling the equipment.
It is applied in turbines, boilers, internal combustion engines, piping, and internal cavities of large equipment. The main benefit is time and cost savings: internal visual inspection that previously required days of disassembly can now be done in hours.
Read also: How to extend the lifespan of your speed reducer.
The P-F curve is one of the most important concepts in reliability engineering and visually explains why predictive maintenance works.
The name comes from two points on an equipment degradation graph:
The space between P and F is called the P-F interval, and this is where predictive maintenance operates. The earlier the monitoring technique detects the degradation signal (point P), the more time is available to plan the intervention before functional failure occurs (point F).
In practice, different predictive techniques detect problems at different moments along the curve. Vibration analysis, for example, typically identifies changes months before functional failure. Operator-perceptible signals (noises, heat to the touch, visible vibrations) appear much closer to point F, when reaction time is shorter.
This is why instrumented predictive maintenance (with sensors and technical analysis) is so valuable for critical assets: it expands the intervention window, giving the team enough time to plan the shutdown, procure parts, organize the workforce, and minimize the impact on production.
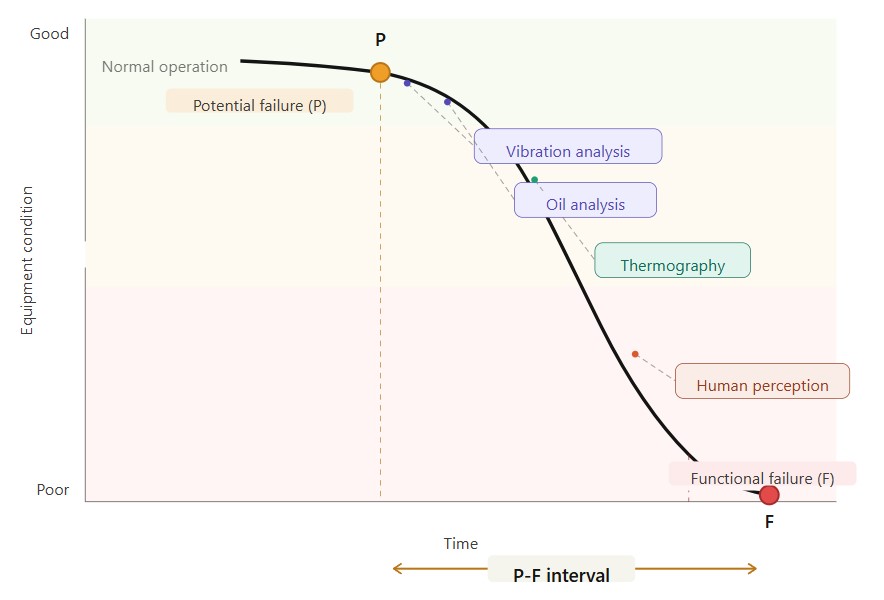
The earlier the detection (point P), the larger the window to plan the intervention before failure (point F).
Predictive maintenance has existed for decades, but it was Industry 4.0 that transformed its delivery capability. The convergence of technologies such as IoT (Internet of Things), artificial intelligence, machine learning, big data, and cloud computing made it possible to monitor hundreds of pieces of equipment simultaneously, process massive volumes of data, and identify degradation patterns that would be invisible to human analysis alone.
Before these technologies, predictive maintenance relied almost exclusively on periodic manual inspections. A technician would walk through the plant with portable instruments, collect data, and spend weeks consolidating the analyses. Today, wireless sensors installed directly on equipment collect vibration, temperature, and other parameter data in real time, sending automatic alerts when a deviation is identified.
This evolution brought concrete benefits:
A growing trend is the concept of digital twin: a virtual replica of the equipment that simulates its behavior in real time based on data collected by sensors. This allows testing scenarios, predicting the progression of a failure, and optimizing maintenance decisions before intervening on the physical equipment.
Field Assist 4.0, developed by Zanini Renk, is a practical example of this evolution. The solution combines intelligent sensors, data analysis, and a specialized technical team to monitor gear reducers and mechanical power transmission equipment 24 hours a day, 7 days a week. When any inconsistency is identified in the monitored parameters, the team of specialists immediately notifies the client, enabling corrective action before the problem affects operation.
To measure whether predictive maintenance is delivering results, it is necessary to track indicators (KPIs) that reflect equipment condition and the efficiency of the maintenance program. The main ones are:
Measures the average interval during which equipment operates without experiencing a failure. The higher the MTBF, the more reliable the asset. Predictive maintenance increases MTBF because interventions correct problems at an early stage, preventing them from evolving into functional failures.
In a mill drive gear reducer, for example, MTBF can increase significantly when vibration and oil analyses allow correcting misalignments and changing lubricant at the right time.
Measures how long it takes to restore equipment after a shutdown. Predictive maintenance reduces MTTR because, when the intervention is planned, parts are already available, the workforce is scheduled, and the service scope is defined.
Emergency repairs, on the other hand, require diagnosis at the time of failure, parts sourcing, and team reallocation, which consumes much more time.
Indicates the percentage of time the equipment is operational and ready to produce. It is calculated by the ratio between MTBF and the sum of MTBF + MTTR. Predictive maintenance improves this indicator on both fronts: it increases MTBF and reduces MTTR.
The overall equipment efficiency indicator that combines availability, performance, and quality. Predictive maintenance directly impacts availability (fewer shutdowns) and performance (equipment operating within ideal parameters). In sectors such as cement and steel, where equipment operates in continuous duty, gaining just a few percentage points in OEE represents significant additional production volumes.
Relates the maintenance investment to the productive output. When predictive maintenance reduces emergency interventions and optimizes the use of parts and labor, this cost decreases.
Implementing predictive maintenance does not mean deploying sensors on every piece of equipment at once. The best results come from a gradual approach, starting with the most critical assets and expanding as the program matures.
The first step is identifying which equipment deserves priority attention. Not every asset justifies the investment in predictive monitoring. Prioritization should consider:
With this information, it is possible to create a criticality ranking and focus the program on the equipment that will deliver the highest return on investment.
With the assets defined, evaluate what already exists at the plant in terms of sensors, software, and team expertise. In many industries, part of the required infrastructure is already available but underutilized.
The choice of techniques should consider the equipment type and the most likely failure mode:
For operations that are just getting started, a pilot project is the safest approach. Choose a critical area of the plant, implement the monitoring, measure the results, and use that success case to justify expanding the program.
Before detecting anomalies, you need to know what is normal. The first months of data collection serve to establish the baseline for each piece of equipment: what are the typical levels of vibration, temperature, and other parameters when the machine is operating under good conditions.
This reference is what allows identifying deviations in the future. A reducer that normally vibrates at 2 mm/s and starts vibrating at 4 mm/s is signaling a change that needs to be investigated, even if it is still within generic acceptance limits.
Data collection can be manual (route inspections with portable instruments) or automated (fixed sensors with continuous transmission). The choice depends on asset criticality and available budget. For extremely critical equipment, such as mill drive gear reducers during harvest season, continuous monitoring justifies the investment.
Data without action produces no results. The analysis needs to turn into a decision, and the decision into intervention at the appropriate time.
Define clear response procedures for each type of alert:
Team training is an essential part of this process. Operators need to understand what the alerts mean. Maintenance technicians need to know how to interpret analysis reports. Managers need to trust the data to make shutdown decisions.
Finally, feedback closes the loop: each intervention performed generates information that helps calibrate predictive models, adjust data collection frequency, and refine alert criteria. Predictive maintenance is a continuous improvement process, not a project with a start and end date.
Implementing predictive maintenance requires initial investment in sensors, software, training, and in some cases, specialized monitoring services. The question every manager asks is: does this investment pay for itself?
The data says yes. McKinsey documented the case of an offshore operator that implemented predictive maintenance across nine platforms and achieved an average 20% reduction in downtime and an increase of 500,000 barrels of oil produced per year. Other studies from the same consultancy point to a 18% to 25% reduction in maintenance costs at companies that adopted the strategy.
The gains come from multiple sources:
To calculate the program's ROI, compare the implementation cost (sensors, software, services, training) with the value of avoided shutdowns, the reduction in repair costs, and the productivity increase. For critical assets such as mill drive gear reducers or kiln drives, the return typically materializes in months, not years.
Predictive maintenance reaches its most complete form when it combines monitoring technology with technical expertise on the equipment being monitored. That is exactly the proposition of Field Assist 4.0, developed by Zanini Renk.
Field Assist 4.0 is an intelligent monitoring solution that tracks the condition of gear reducers and mechanical power transmission equipment continuously, 24 hours a day, 7 days a week. The Zanini Renk technical team, which designs and manufactures this equipment, is the same team that analyzes the data and guides maintenance decisions.
The monitoring is performed by those who deeply understand the mechanical behavior of each reducer model, which enables more accurate diagnostics and more effective recommendations.
The main features of Field Assist 4.0 include:
Learn more about Field Assist 4.0 and how it can integrate into your operation's predictive maintenance strategy. If you prefer, speak directly with the Zanini Renk team.