+1 (226) 337-9660

 English
Search

In an industrial plant, an unplanned stop of a gear reducer can cost thousands of dollars per hour. The oil analysis report is one of the most useful tools in predictive maintenance, because it reveals signs of internal wear before any visible symptom appears. But receiving the report is only half the job: what really matters is knowing how to interpret the data and take the right action at the right time.
A lubricating oil analysis report brings together three main pieces of information: the condition of the oil, the presence of external contaminants, and signs of internal wear in the gear reducer. All of them need to be analyzed together, because a single parameter rarely explains the real condition of the equipment.
The oil condition shows whether the lubricant can still do its job. To assess it, the report evaluates parameters such as:
In practical terms, this part of the report shows whether the oil still forms a lubricating film, reduces friction, helps control temperature, protects against corrosion, and carries particles to the filtration system. These requirements apply to lubricating oils for industrial gear reducers lubricated by splash or under pressure, especially in applications that demand high wear protection.
Water, dust, solid particles, and process residues can get in through breathers, seals, improper oil handling, storage failures, or exposure of the gear reducer to humidity, steam, excessive heat, dirt, or chemicals. This changes how the report is read, because wear may be accelerated by contamination, not by a failure that started in the internal components.
A rise in silicon, for example, usually indicates that dust or abrasive particles have entered the gear reducer. If iron starts to climb at the same time, there is evidence that this contamination may already be accelerating internal wear. When iron rises without this contamination signal, the investigation takes another path, focused on the components of the speed reducer itself.
Metal particles in the oil can come from gears, rolling bearings, plain bearings, shafts, or seals. Since each component has a specific metallic composition, the type of element found in the report points to where the problem is happening. Interpreting metals such as iron, chromium, copper, tin, aluminum, or nickel without knowing how the gear reducer is built leads to incomplete conclusions.
Here is the difference in practice:
In both cases there is iron in the oil, but the cause and the corrective action are completely different.
To dig deeper into this diagnosis, analytical ferrography evaluates the size, shape, composition, and distribution of the particles suspended in the oil. This helps tell normal wear apart from serious problems such as surface fatigue, abrasion, or cutting wear particles.
That is the difference between reading and interpreting the report. Reading means looking at the numbers. Interpreting means cross-checking those numbers with the gear reducer model, the oil in use, the load, the operating temperature, and the equipment history.
The report should not be treated as a simple pass or fail for the oil. In industrial gear reducers, it is a way to understand what is happening inside the equipment. When properly interpreted, it shows whether the lubricant is still protecting the components, whether the gear reducer is being contaminated from the outside, and whether any internal component has already started to degrade.
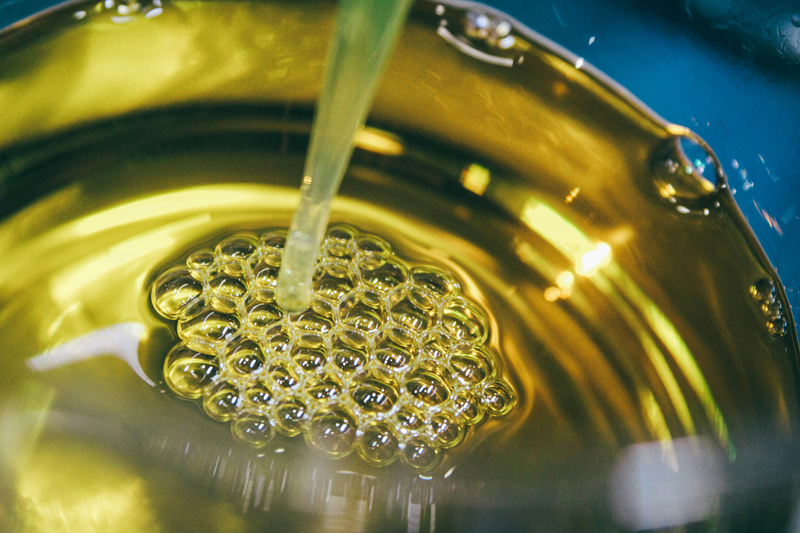
An oil analysis report for industrial gear reducers usually combines physicochemical, contamination, and wear tests and, as we have seen, the set needs to be read as a whole. In a gearbox, viscosity, water, metals, acidity, and particles tell different parts of the same story:
Viscosity is one of the first items to evaluate in the report, because it tells you about the oil’s ability to form a film between the gear teeth and in the bearing contact areas.
If the oil becomes too thin, this film may not be enough to carry the load. If it becomes too thick, it can hinder circulation, raise the temperature, and compromise lubrication at critical points.
In industrial gear reducers, viscosity must be compared with that of the new oil used as a reference. This equipment typically runs on ISO VG 220, 320, or 460 oils, depending on the application, load, speed, temperature, and type of lubrication.
In practice:
|
Viscosity change |
How to interpret it |
|
Up to ±10% from the ISO grade |
Within normal range. |
|
Between ±10% and ±20% |
Requires attention and closer monitoring. |
|
Above ±20% |
An oil change should be considered. |
Technical studies on gear oil also confirm that significant viscosity changes compromise lubrication and should guide maintenance action. And the cause of the change matters as much as the number itself:
|
Viscosity change |
What it may indicate |
|
Increased viscosity |
Oxidation, water ingress, or use of the wrong oil. |
|
Decreased viscosity |
Solvent contamination, breakdown of viscosity-modifying additives, or mixing with an oil of a lower ISO grade. |
That is why, when viscosity moves away from the expected value, it is important to find out why the oil changed. A case on oil analysis interpretation in gearboxes, published by Sumitomo Drive Technologies, shows this relationship: in a conveyor gear reducer that had been running for about 10 years, the use of a 150 cSt oil not approved by the manufacturer was linked to an increase in ferrous particles. When the oil was corrected to 220 cSt, as per the approved specification, the generation of iron particles dropped by more than 50%.
Water in the oil is critical in gear reducers because it interferes with the lubricating film, promotes corrosion, accelerates oxidation, and can shorten bearing life. That is why, in gear systems, water must be taken seriously even at low levels.
The Timken technical guide on bearing lubrication and water contamination indicates that:
In other words, there is no need for visible water in the oil for damage to begin.
For industrial gear reducers, the Karl Fischer test is the most suitable method, because it quantitatively measures the exact water concentration in the oil (in ppm or mass percentage). The crackle test can signal the presence of moisture, but it is only qualitative and not very precise. In critical systems, waiting for water to become visible to the naked eye usually means acting too late.
Several situations can introduce water into the unit:
Metal spectrometry measures the amount and type of chemical elements present in the oil.
In an industrial gear reducer, components such as gears, rolling bearings, bushings, plain bearings, shafts, and housings are made of different materials (iron, chromium, bronze, or aluminum, for example). So when the oil shows a high concentration of a specific metal, it is possible to trace which internal part has started to degrade.
The table below shows what each element may indicate:
|
Element |
What it may indicate in the gear reducer |
Suggested first action |
|
Iron (Fe) |
Wear of gears, shafts, or internal ferrous surfaces |
Compare with history, evaluate the trend, and cross-check with vibration data |
|
Chromium (Cr) |
Possible wear of rolling bearings or alloy steel components |
Check bearings, vibration pattern, and temperature |
|
Copper (Cu) |
Wear of bushings, plain bearings, or internal metal alloys |
Inspect copper alloy components and check lubrication |
|
Silicon (Si) |
Ingress of dust, abrasive particles, or external contamination |
Check breather, seals, filtration, and oil storage |
|
Aluminum (Al) |
External contamination or component wear, depending on its relationship with silicon |
Compare with silicon and investigate filters, seals, and internal components |
The number of elements analyzed also changes the depth of the diagnosis. Basic predictive analysis packages usually assess a smaller set of wear metals, while more complete analyses, with more elements, also show additives and contaminants in greater detail. This helps tell mechanical wear apart from degradation of the oil’s own additive package.
The Total Acid Number (TAN) measures the acidity accumulated in the lubricant, in mg KOH/g. In industrial gear reducers, this test assesses oil aging through oxidation and the depletion of protective additives. The sample result must always be compared with that of the new oil, since some lubricants already leave the factory with a high initial TAN because of their additive package.
The warning sign appears when TAN shows a consistent increase over the new oil value (generally an increase of 0.5 to 1.0 mg KOH/g), which indicates new acids forming through oxidation. When TAN reaches critical values (above 2.0 to 3.0 mg KOH/g, for example), the oil becomes corrosive to metal surfaces and changing it becomes urgent.
Temperature directly accelerates this process. According to a well-established rule of thumb in tribology, for every 10 °C increase in operating temperature, the oil oxidation rate tends to double. A gear reducer running 20 °C above design temperature therefore ages its lubricant up to four times faster, drastically shortening its service life.
The ISO 4406 particle count shows the cleanliness level of the oil with three numbers separated by slashes, such as 18/16/13. Each number represents the amount of particles per milliliter within a size range:
The lower the code, the cleaner the oil.

Traditional spectrometry (ICP) is excellent for tracking metal trends in parts per million (ppm). However, it has a critical limitation in gear reducers: it only detects particles smaller than 10 microns.
Since gear and bearing failures usually generate much larger fragments, the report may show "stable" iron levels while the equipment is deteriorating inside. To avoid this false sense of security, the diagnosis should be complemented by three key analyses.
The PQ Index measures the total mass of ferrous material in the sample, regardless of particle size.
In this scenario, changing the oil is not enough. The equipment must be investigated right away with vibration analysis, borescope inspection, or ferrography.
Analytical ferrography complements this diagnosis by separating particles by size and shape on a glass slide, using a magnetic field. The analyst then examines these particles under a microscope and evaluates not only how much wear there is, but also what type of wear is happening. For example:
|
Particle type |
What it may indicate |
|
Elongated particles |
Sliding wear. |
|
Larger, irregular fragments |
Surface fatigue. |
|
Particles showing signs of oxidation |
Corrosion or water contamination. |
This difference is decisive in gear reducers. Knowing there is iron in the oil is useful, but knowing whether that iron comes from normal wear, abrasion, gear fatigue, or corrosion changes the maintenance action. In some cases, the decision may be to improve filtration and shorten the sampling interval. In others, it may be necessary to:
It is worth stressing that ferrography does not replace spectrometry, because each one answers a different question. Spectrometry tracks how chemical elements evolve over time, while ferrography shows the morphology of the particles, that is, their shape, size, and type of wear. Used together, they give a much more complete picture of the gear reducer’s internal condition.
Instead of evaluating only the oil collected in the sample, this method analyzes the material trapped in the filter element over weeks of operation. As Machinery Lubrication explains, the process removes particles from the filter media and isolates them for laboratory analysis, allowing the type, size, and shape of the debris to be assessed. This is especially useful in gear reducers with filtration systems, because the filter may have captured precisely the larger particles that do not show up well in conventional oil analysis.
The reliability of an oil analysis report depends not only on the precision of the laboratory, but on the quality of the sampling done in the field. If the sample is collected incorrectly, the entire investment in predictive analysis is wasted, and the resulting misdiagnoses can mask serious failures in industrial gear reducers.
Oil analysis begins before the laboratory. In industrial gear reducers, a poorly executed sampling can produce a report that looks normal but does not reflect the real condition of the equipment. This happens because wear particles, water, and contaminants are not evenly distributed in the reservoir under all operating conditions.
The sampling point must be located in an active flow zone, where the oil carries real-time information from the contact between gears and bearings.
Before filling the final bottle, the sampling point must be flushed with the system’s own oil. This step removes residues from previous samples, dirt accumulated in the valve, and moisture in the line, so the laboratory analyzes only the oil that is actually circulating.
The context sent to the laboratory is just as important as the physical sample. To deliver an accurate interpretation, analysts need to receive:
Without this information, the report loses technical value. The laboratory can measure viscosity, acidity, and metal content, but it cannot tell whether those values represent natural degradation, the effect of a recent intervention, or a critical failure trend. The quality of the technical decision depends directly on the quality of the sample and the data that comes with it.
Setting oil analysis intervals by the calendar alone (monthly, quarterly, or twice a year) is a common mistake in maintenance. To get the frequency right, you need to understand a fundamental concept of predictive maintenance: the P-F curve.
The P-F curve shows how equipment behaves over time once a degradation process begins:
The distance between point P and point F is the window of opportunity your team has to identify the problem, plan the maintenance, and intervene without causing an unplanned shutdown.
For oil analysis to work as an effective early warning tool, the interval between samples must be considerably shorter than the P-F interval.
If a failure mode develops within 250 operating hours, for example, sampling twice a year is useless: the problem will appear, progress, and break the gear reducer before the analysis has a chance to alert the team.
Sampling frequency should take four key criteria into account:
|
Criterion |
Why it affects sampling frequency |
|
Gear reducer criticality |
The greater the impact of a failure on production, the shorter the interval between samples should be. |
|
Equipment history |
Gear reducers with previous failures or a wear trend require closer monitoring. |
|
Operating conditions |
Load, temperature, humidity, dust, and duty cycle can accelerate oil degradation and internal wear. |
|
Response window (P-F interval) |
Sampling must ensure that changes in the oil are detected early enough to buy parts and schedule the maintenance stop. |
The initial sampling frequency should be set according to the impact the gear reducer has on the production process:
Real predictive maintenance is dynamic. The original schedule should be broken immediately, and the next sample brought forward, whenever any of these triggers appears:
|
Trigger observed |
Why the next sample should be brought forward |
|
Dust, humidity, extreme heat, or area washdowns |
They drastically accelerate oil oxidation and the risk of water contamination. |
|
Rising trend in wear metals or PQ Index |
Indicates that an internal component (gear or bearing) has started to degrade. |
|
Oil at an advanced stage of use (high TAN) |
Once the additives are depleted, degradation and acidity start to increase exponentially. |
|
Recent intervention (oil change, seals, or parts) |
Closer sampling at the start confirms that new parts have bedded in and that the intervention solved the problem. |
|
Equipment without redundancy in the line |
There is zero tolerance for uncertainty. |
A new or recently overhauled gear reducer may need samples every two weeks during its first month to establish a baseline. Once the indicators prove stable, the interval can be safely extended.
Likewise, at the slightest sign of an anomaly (such as a rise in TAN or particle count), next month’s sample should be moved to next week.
In short: the goal is not to sample oil all the time, but to sample intelligently. The sampling schedule should be a living plan, constantly adjusted by the combination of criticality, asset history, the P-F curve, and the real operating environment.

An oil analysis report has to lead to a practical decision. Each laboratory uses its own way of flagging results, such as colors, ranges, or severity levels, but interpretation can be organized into three types of alerts:
A high silicon content combined with rising iron, for example, usually points to dust or abrasive particles getting in and accelerating internal wear. In this case, the first action is not necessarily to open the gear reducer, but to stop the contaminant from getting in. That means checking:
If the external cause remains, an oil change will only solve the problem temporarily. That is why it is important to understand what the report is showing and whether the action should be external, internal, or both.
An approved oil is a lubricant that has passed rigorous testing and received official, formal approval from the equipment manufacturer (the OEM, or original equipment manufacturer). Using the right lubricant is not just about preserving the warranty or protecting the gears: it is also what ensures the accuracy of the laboratory analysis.
The report does not measure only wear metals or dirt. It also identifies the chemical elements in the oil’s own additive package (such as zinc, phosphorus, calcium, boron, and silicon).
Without the approved specification and a sample of new oil as a reference, interpretation is compromised for two main reasons:
Gear reducer manufacturers such as Zanini Renk set strict criteria for oil approval (DIN 51517 Part 3, CLP classification, extreme pressure performance, and aging stability).
These requirements protect the mechanics of the equipment and make the chemical behavior of the oil predictable throughout its entire service life.
Oil analysis only works when the data is reliable and interpreted in the right context. Small deviations in sampling or in reading the report can lead to misdiagnoses, resulting in unnecessary shutdowns or, worse, severe failures that go unnoticed.
The golden rule of initial sampling: Machinery Lubrication and manufacturers such as Sumitomo recommend that the very first sample sent to the laboratory be of new, unused oil. This reference reveals the exact chemistry of the product’s original formulation. Without it, elements of the additive package (such as zinc, phosphorus, and calcium) can be mistaken for contaminants or wear, compromising the diagnosis from day one.
An oil analysis report only delivers predictive intelligence when it rests on a solid technical foundation: an approved lubricant, well-executed sampling, and interpretation aligned with the original design of the equipment. Neglecting any of these steps exposes the operation to unnecessary shutdowns or, worse, catastrophic failures in critical components.
As a manufacturer of industrial gear reducers, Zanini Renk provides specialized technical support to align the report guidelines with the real application of your asset, considering load, temperature, duty cycle, and criticality.
If your gear reducer operates under severe conditions or is a key piece of your production line, this evaluation helps you make safe decisions before wear signals turn into losses.
Want to get the longest possible service life from your asset? Check the list of Zanini Renk approved oils or talk to our technical team to evaluate the exact application of your gear reducer.